
GRAFANA

Grafana: Making Your Factory's Data Visible
A factory can be collecting accurate, high-quality data and still be operating in the dark, if nobody has a clear way to see it. Grafana is the visualisation platform INGSOL uses to turn stored time-series and operational data into dashboards that operators, supervisors and management actually look at and act on. This page explains what Grafana is, how INGSOL uses it, and how it fits within our wider technology stack for factories and manufacturing plants
What Is Grafana?
Grafana is an open-source platform for querying, visualising and alerting on time-series and operational data. It connects to a wide range of data sources, including relational and time-series databases, and presents that data through configurable dashboards, charts and panels that update in real time.
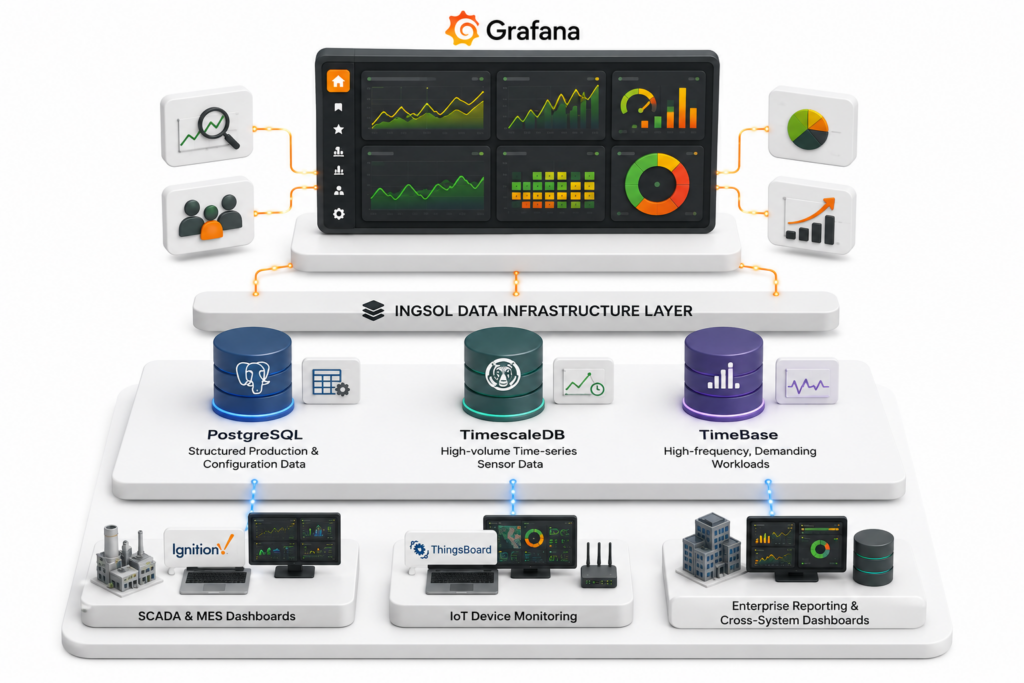
Grafana is not a database itself, and it does not collect data directly from machines or sensors. Its role is to sit on top of the data infrastructure a factory already has, whether that is PostgreSQL, TimescaleDB, TimeBase or another source, and present that data in a form people can interpret at a glance, rather than as raw numbers in a table.
Why INGSOL Includes Grafana in the Stack
BROAD DATA SOURCE SUPPORT:
Grafana connects to PostgreSQL, TimescaleDB, TimeBase and many other data sources through a single platform, avoiding a separate reporting tool for every system
REAL-TIME VISUALISATION:
Dashboards refresh continuously, giving operators and supervisors a live view of equipment status, quality and energy metrics rather than a static, end-of-shift report
HIGHLY CONFIGURABLE DASHBOARDS:
Panels, thresholds and layouts are configured around the specific metrics that matter to a given role or line, rather than a fixed, generic template.
ALERTING BUILT IN:
Built-in alerting notifies the right people when a metric crosses a defined threshold, closing the gap between an issue occurring and someone being told about it.
OPEN AND VENDOR-NEUTRAL:
As an open-source platform, Grafana avoids dependence on a single proprietary visualisation vendor, and can be deployed on-premises or in the cloud.
Where INGSOL Applies Analytics
Real-Time OEE and Production Dashboards
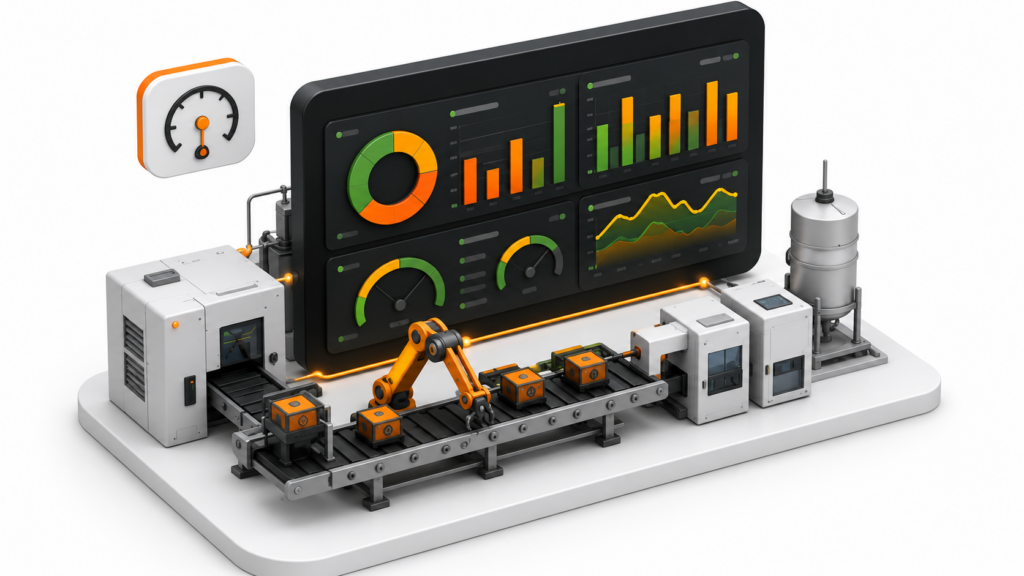
INGSOL builds Grafana dashboards that present Overall Equipment Effectiveness (OEE) by equipment and production line, broken down into availability, performance and quality components, so supervisors can see exactly where losses are occurring as they happen, rather than after a shift ends.
Energy and Utility Monitoring
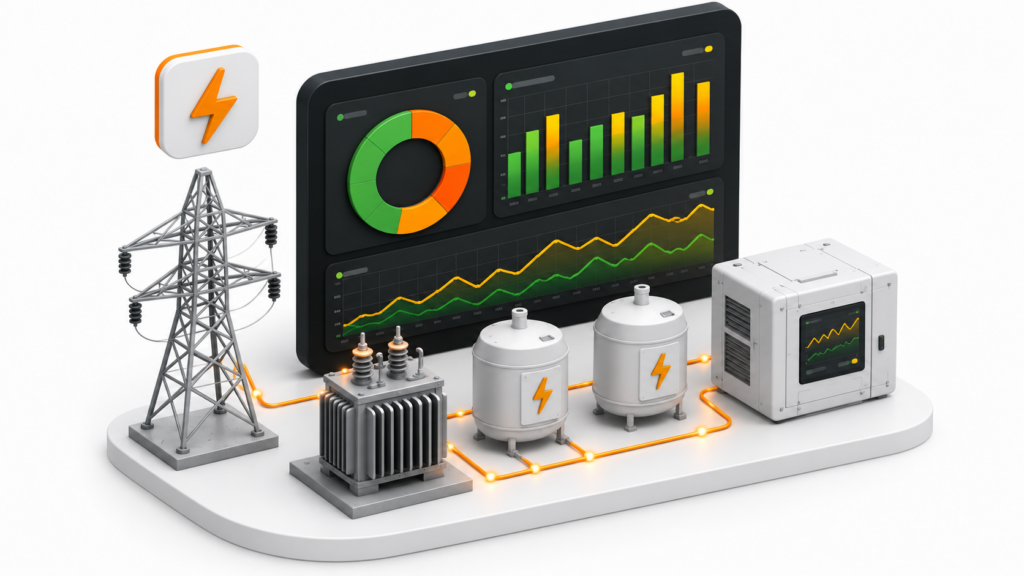
Grafana dashboards track energy consumption per unit of output at the asset level, drawing on data stored in TimescaleDB, making it possible to spot inefficient equipment and unusual consumption patterns as they develop.
Quality and Process Trending
Trend panels in Grafana allow quality parameters, such as gauge, tension or temperature, to be tracked over time and correlated with process conditions, supporting root-cause analysis when quality issues occur.
Equipment Health and Predictive Maintenance Alerts
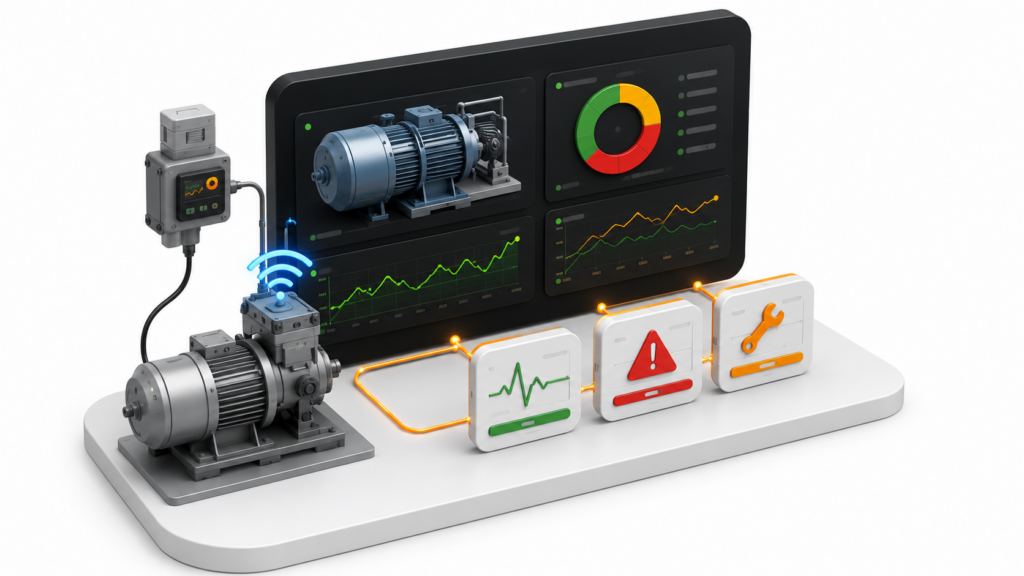
Where INGSOL deploys predictive maintenance models based on vibration, temperature and energy trends, Grafana presents the resulting equipment health scores and alerts, giving maintenance teams early visibility of developing issues alongside the underlying sensor data.
Enterprise and Multi-Site Dashboards
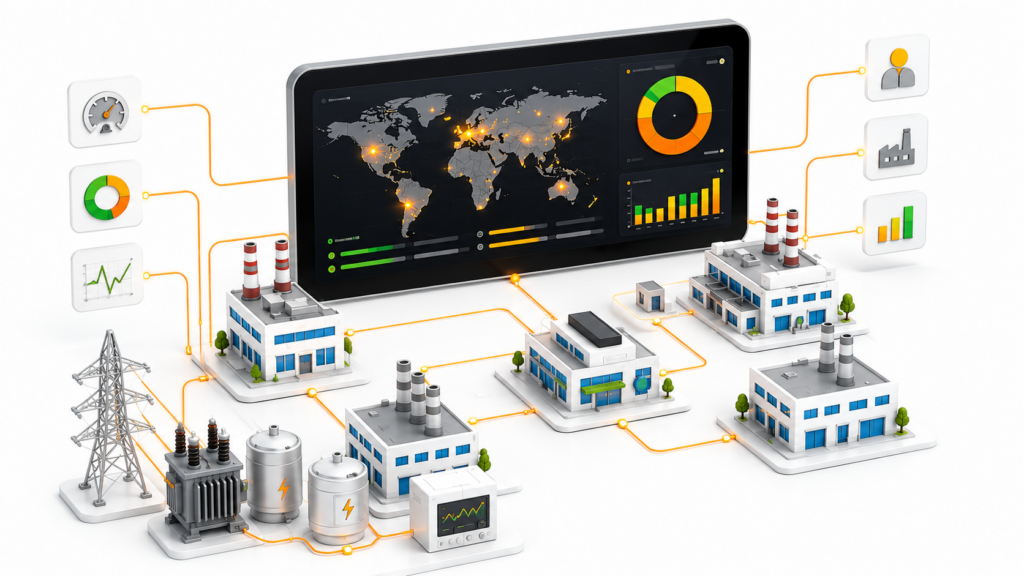
For manufacturers operating more than one site, Grafana can aggregate data across plants into enterprise-level dashboards, supporting cross-site benchmarking and reporting for management, without requiring each site’s local dashboards to be rebuilt separately.
Grafana Within the INGSOL Technology Stack
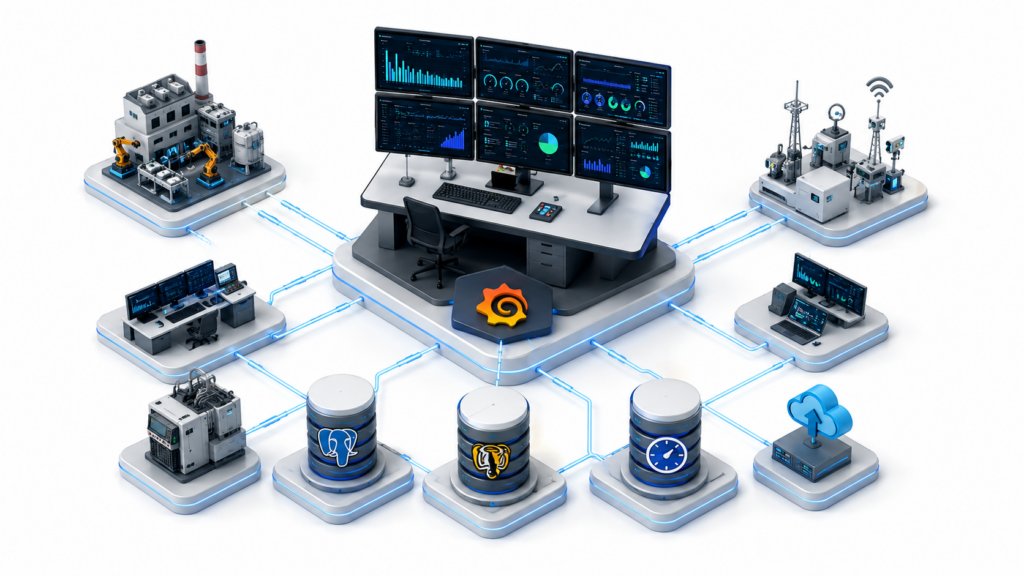
Grafana sits on top of INGSOL’s data infrastructure layer, drawing on PostgreSQL for structured production and configuration data, TimescaleDB for high-volume time-series sensor data, and TimeBase for particularly demanding, high-frequency workloads. It complements the dashboards built directly in Ignition, our core SCADA and MES platform, and in ThingsBoard for device-level IoT monitoring, typically handling broader trend analysis, cross-system dashboards and enterprise-level reporting where a unified view across multiple data sources is needed.
Why Manufacturers Choose INGSOL's Grafana Implementation
Dashboards are designed around the metrics and losses that matter to your specific process and equipment, not a generic monitoring template.
As an open-source platform, Grafana avoids locking your factory into a single proprietary reporting or visualisation vendor.
Grafana is deployed as part of INGSOL's wider data infrastructure and analytics capability, so dashboards are built on reliable, well-structured data from day one.
Dashboards can start with a single line or plant and extend across additional sites and metrics without a platform change.
INGSOL builds Grafana dashboards that turn your factory's data into a live, understandable view of performance, quality and energy use. Get in touch to discuss how Grafana fits your technology stack, or a Digital Transformation Maturity Assessment for your plant
Our Clients