Real-Time Production Monitoring: How Ignition Gives Plant Managers Full Visibility
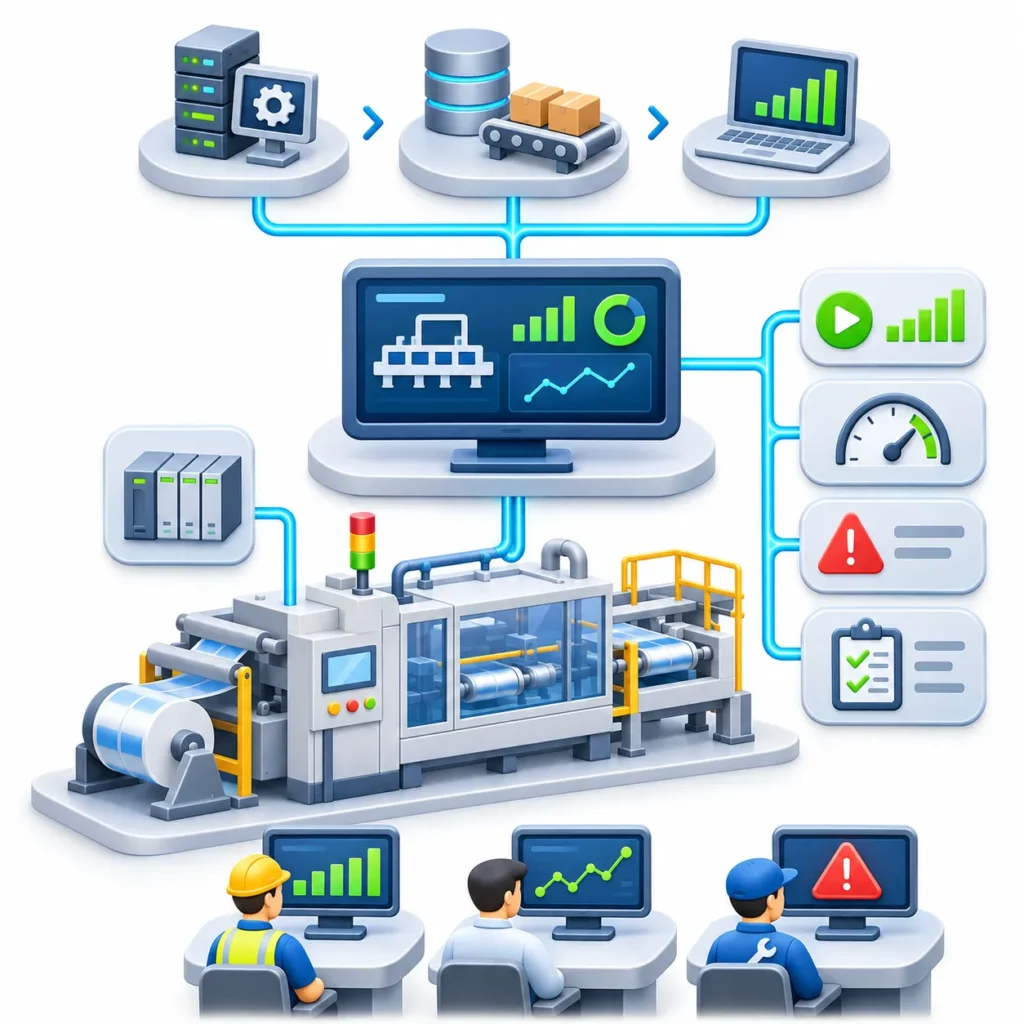
Ignition gives plant managers visibility into production by connecting to PLCs and machines, turning their signals into live tags, and showing status, counts, alarms and trends on web and mobile dashboards. Add a historian and, optionally, MES modules, and the same data supports shift reports, downtime analysis and OEE.
“Full visibility” has a boundary, though: you can only see what is connected, modeled correctly and trusted. This article explains what real-time production monitoring involves, how Ignition delivers it, what a plant manager’s screen should contain, and where the limits are.
What Is Real-Time Production Monitoring?
Real-time production monitoring means collecting machine and process data while production is happening and showing it to people quickly enough for them to act. In practice it is near real time: how fresh the data is depends on how often values are polled or subscribed and how the system is designed.
It differs from end-of-shift reporting. A paper log or spreadsheet tells you what went wrong yesterday. Monitoring tells you what is happening now, while there is still time to fix it.
The data typically includes:
- Machine state (running, idle, faulted, stopped)
- Production counts and rate compared with target
- Fault codes and active alarms
- Reject or quality counts, where the machine reports them
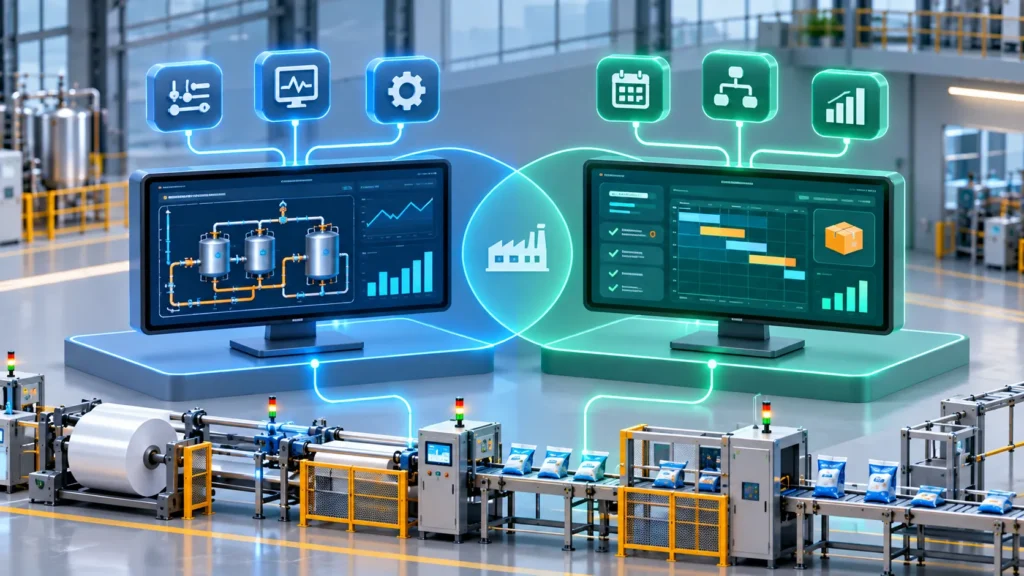
It helps to be clear about roles. PLCs control machines. SCADA supervises and visualizes the process. An MES manages production execution, and ERP handles business planning. Ignition is a platform that covers the SCADA layer and, with additional modules, reaches into MES territory.
What Plant Managers Actually Need to See
Plant managers rarely need every tag. They need answers to a short list of questions, and each question maps to specific data.
Question | Data needed | Ignition capability |
Is each line running right now? | Machine state | Tags and status dashboards |
Are we on pace for the shift target? | Counts, rate, target | Tags, expressions, dashboards |
What stopped us, and for how long? | State changes, fault codes | Alarm journal and tag history; reason codes need MES modules or custom logic |
Who needs to know about a problem? | Alarm priority, on-call roster | Alarm notification pipelines |
How did this week compare with last? | Historical values | Tag Historian, charts, reports |
What is our OEE? | Availability, performance, quality | MES modules such as Sepasoft OEE Downtime (a separate product) |
How Ignition Delivers Production Visibility
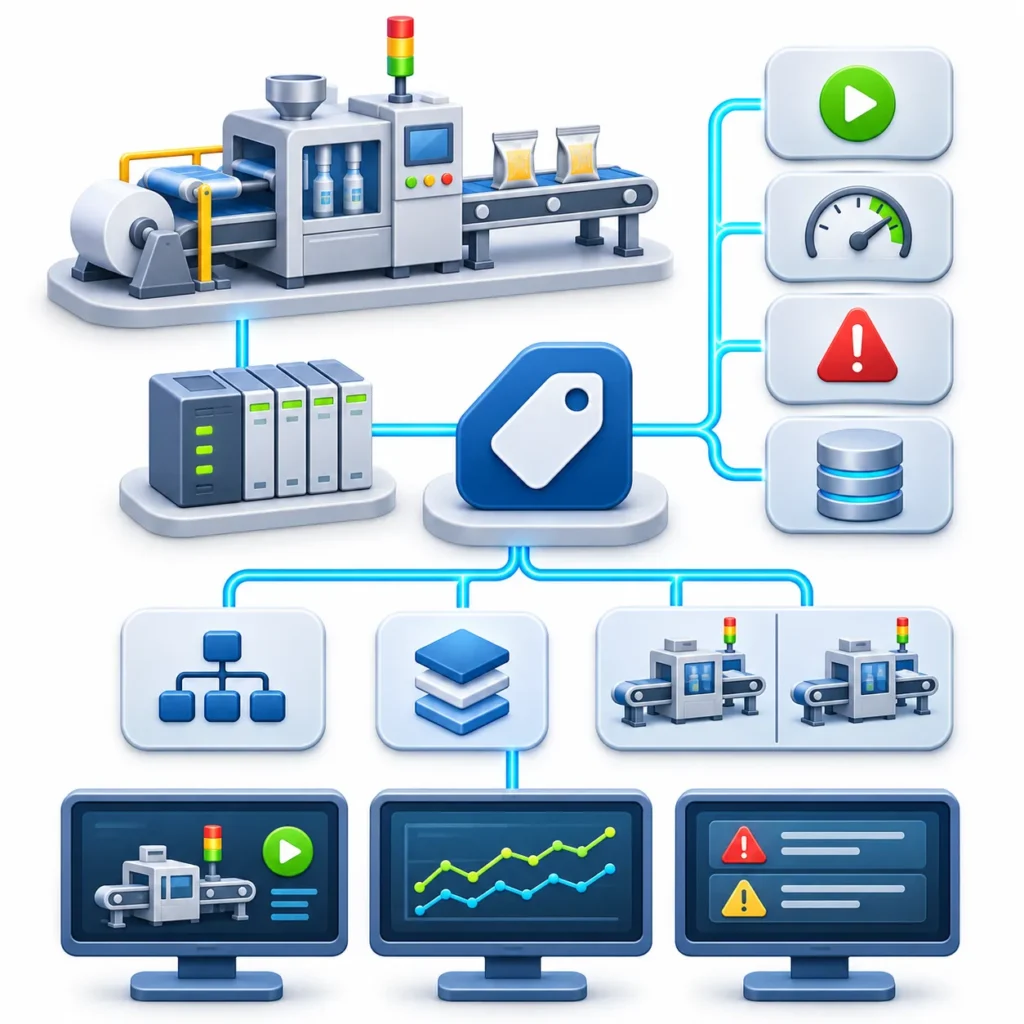
1. Tags: Turning Machine Signals into Data
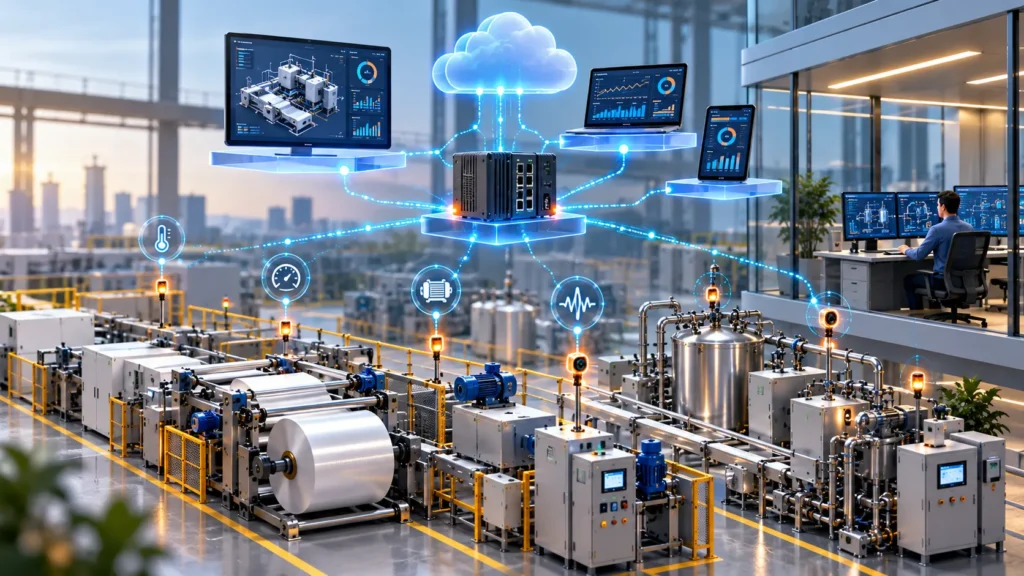
Tags are Ignition’s real-time data points. A tag links to a PLC address or another source and can also carry alarm and history settings. Good visibility starts here: consistent tag names, clear state definitions, and reusable machine templates (Ignition calls these UDTs) so that Line 1 and Line 2 look the same on the screen.
Decide early what “running” means. If one machine reports running while idling and another does not, a dashboard comparing them will mislead.
2. Perspective: Dashboards in a Browser or on a Phone
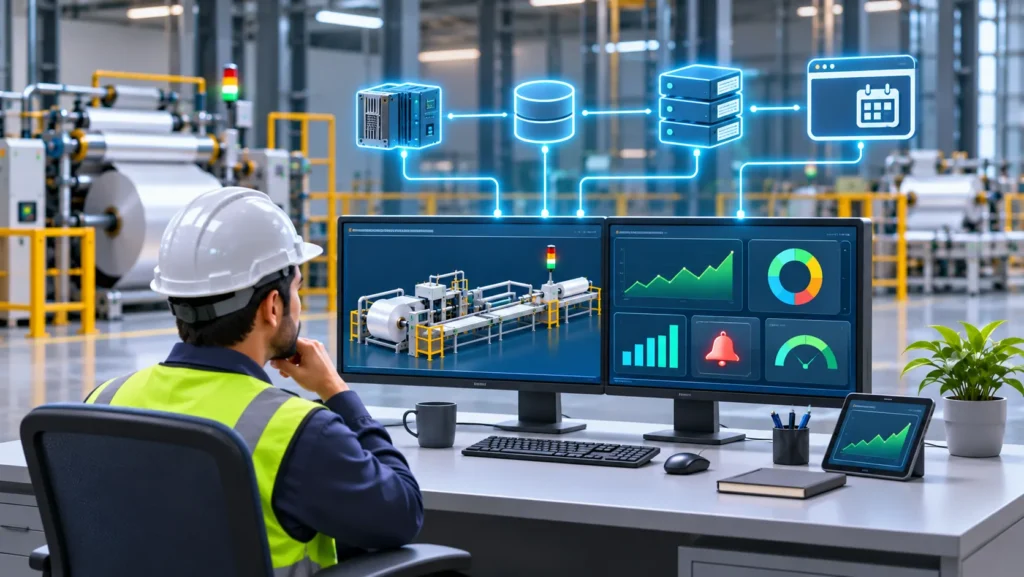
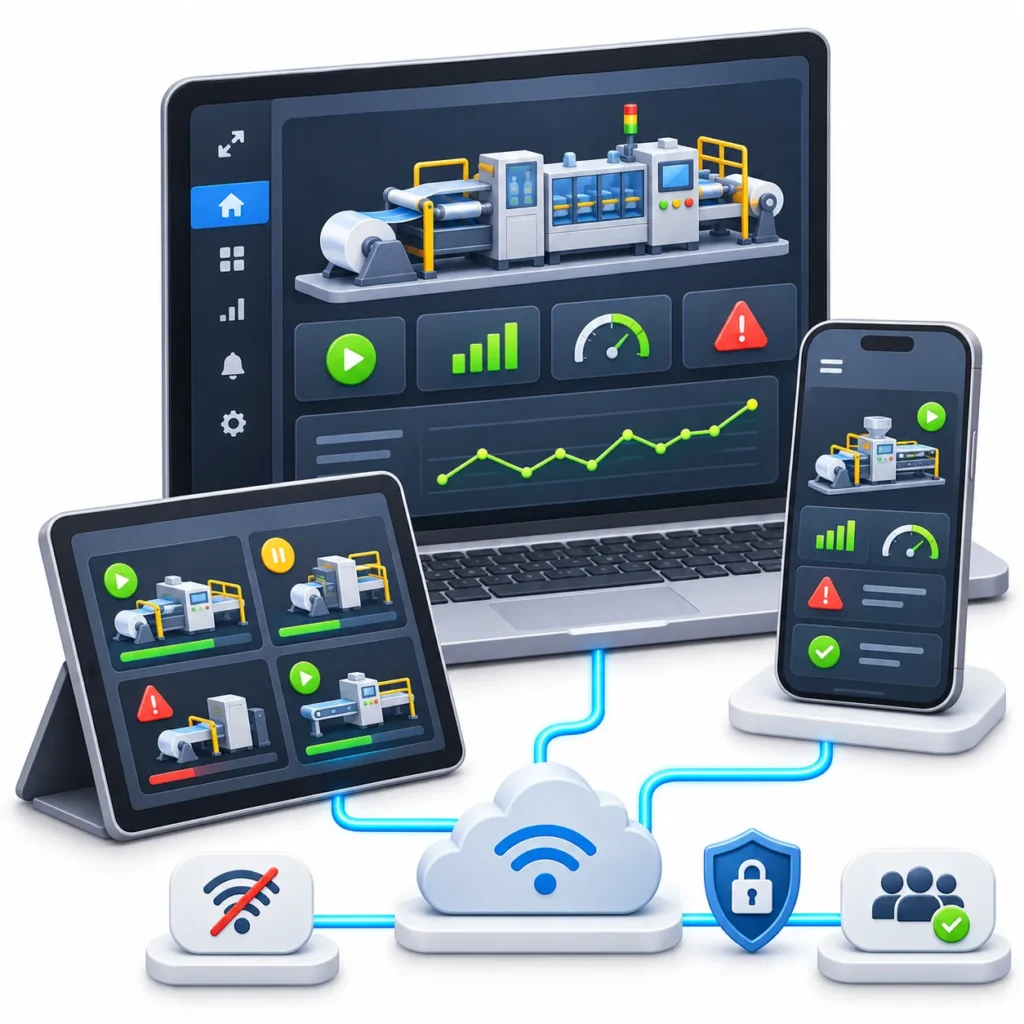
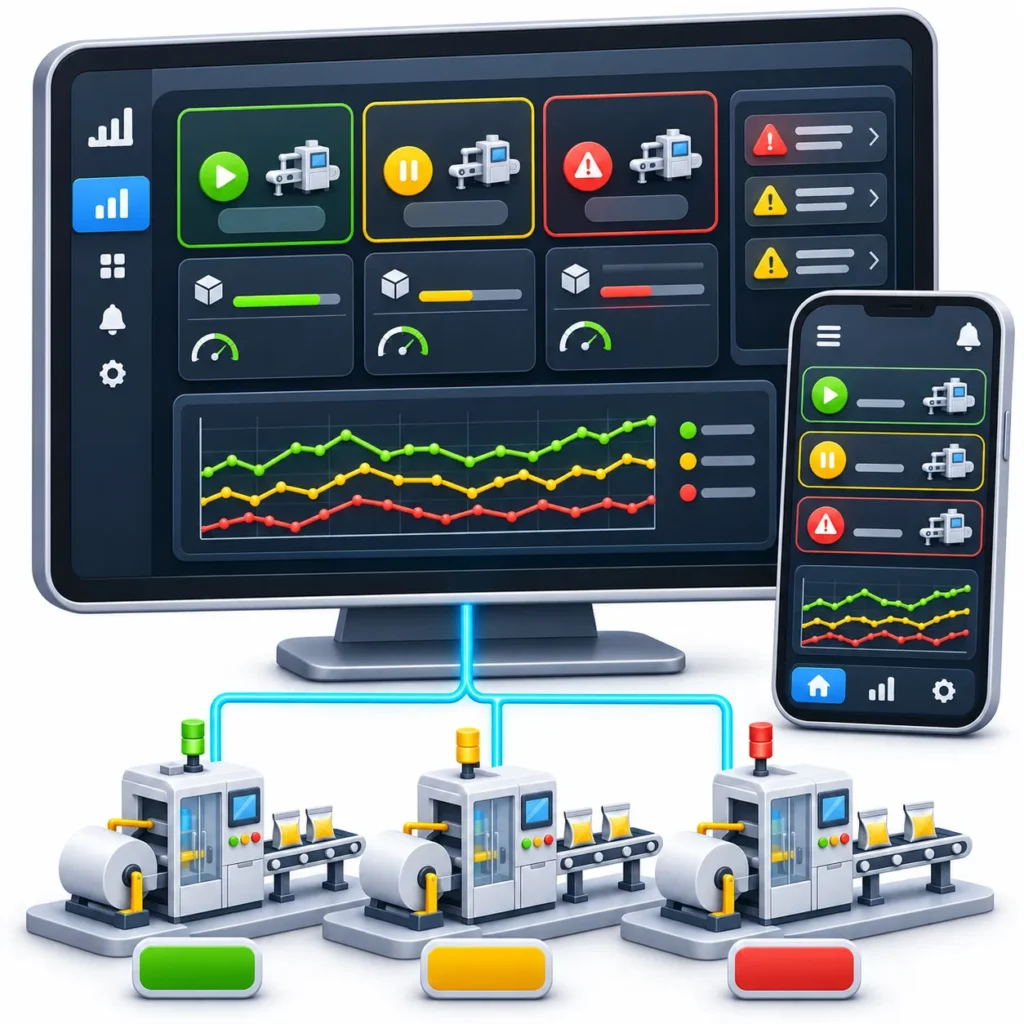
Per Inductive Automation’s documentation, the Perspective module runs in a web browser instead of a Java client and is designed to be mobile responsive. Projects can run in a browser or in a native app on Android and iOS devices, and the screens adapt to different sizes and orientations.
Components are connected to live data through bindings. A binding lets a property on a component, such as the level shown on a tank graphic, change when a value elsewhere in Ignition changes. For a plant manager, that means a status tile, a counter or a gauge can follow the underlying tag without anyone refreshing a report.
Two details matter for managers who are often away from a desk. Perspective sessions can run in an offline mode with limited capability when the network is poor. And the documentation describes secured, encrypted client connections and a guest mode that prevents unauthorized writes. Ignition also offers the Vision module for desktop clients, which some control rooms still use.
3. Alarms and Notifications: Reaching People Who Are Not Watching
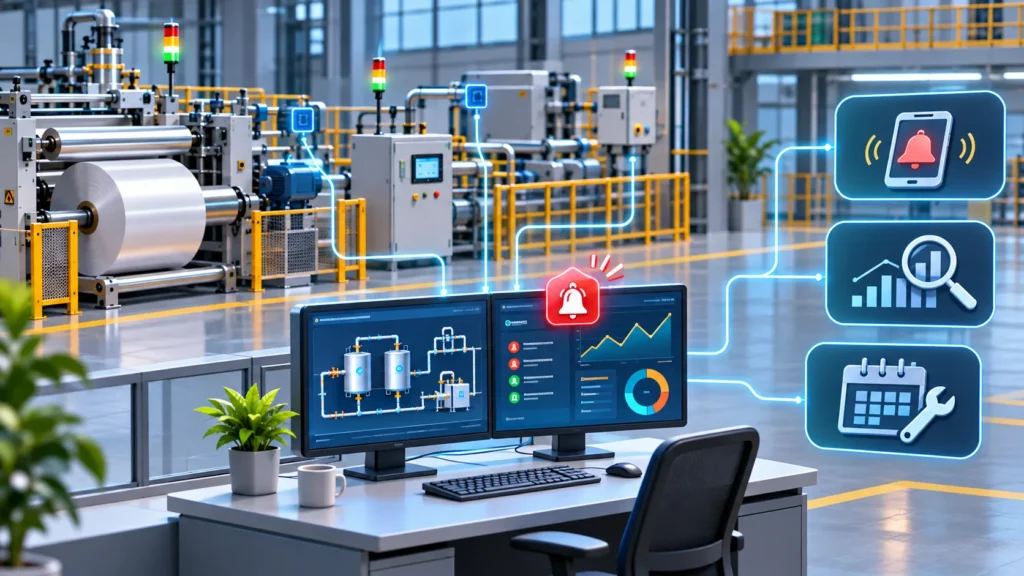
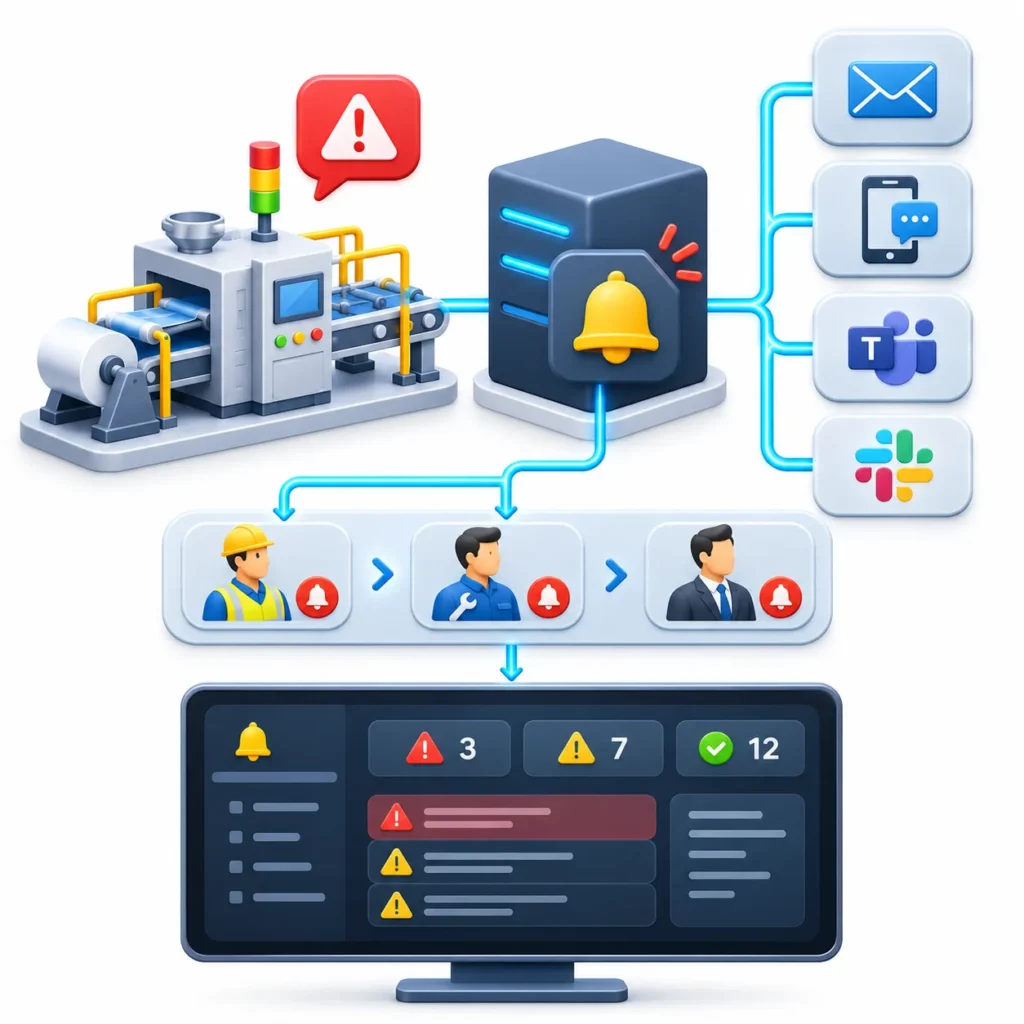
A dashboard only helps when someone looks at it. The Alarm Notification module covers the gap by sending messages when alarms become active, acknowledged or cleared, using pipelines to route and escalate them. Notifications need a configured profile, such as email, and external services such as an email server, so test them regularly.
The overview screen should show only alarms that need action. Dozens of low-value alarms bury the important ones and weaken visibility rather than improving it.
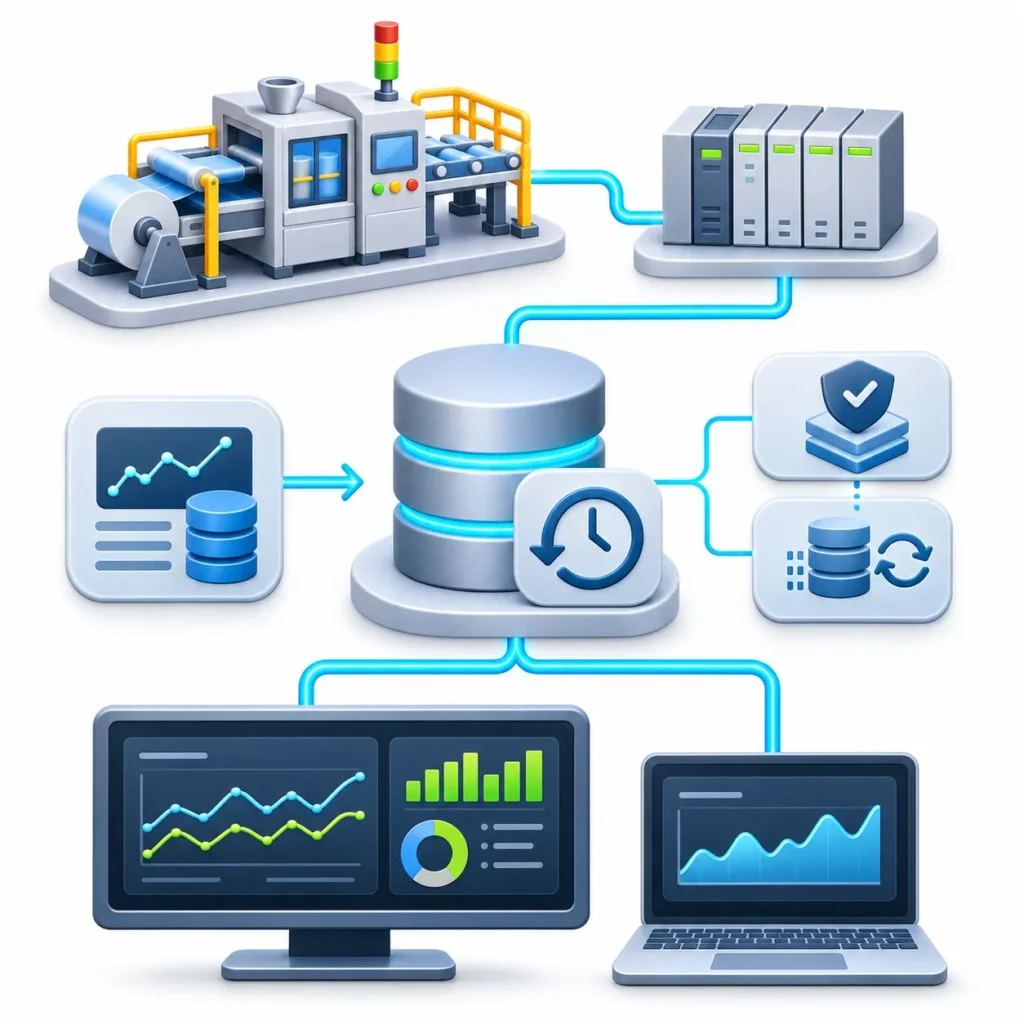
4. Historian: Context for What Is Happening Now
A live number is more useful next to its history. Per the documentation, when history is enabled on a tag, its values are stored through a configured historian provider. Stored history can be shown in trend charts, tables, bindings and reports. In Vision and Perspective you can drag tags onto charts to create trend pens.
Reliability matters here. Ignition’s Store and Forward system is described as a reliable way to store data to the database. For SQL-based historians, records are queued temporarily if the database cannot be reached and written when the connection returns. Note that the documentation says the newer Core Historian in Ignition 8.3 writes directly to disk and does not use Store and Forward, so confirm which historian your version uses.
5. MES Modules: OEE and Downtime Reasons
Ignition alone gives you states, counts and alarms. For OEE and structured downtime reasons, plants commonly add MES modules. Sepasoft’s OEE Downtime module, a separate product built on Ignition, describes collecting production counts, cycle times and downtime events to show how each line is performing. Its documentation also lists analysis values such as OEE, availability, performance, quality, planned downtime and unplanned downtime.
OEE is commonly defined as the product of availability, performance and quality. Because Sepasoft’s pages are vendor documentation, treat them as evidence of what the product does, not as independent proof of results.
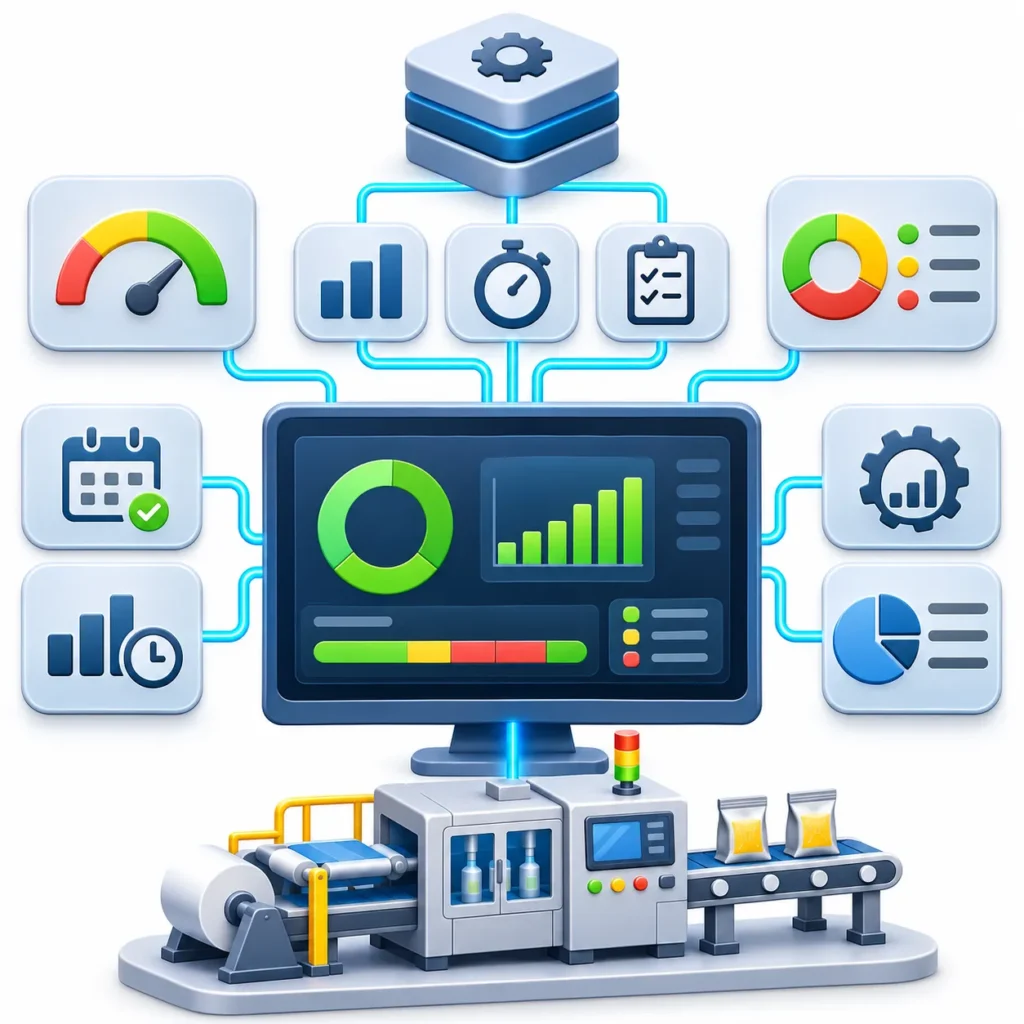
Example: A Three-Line Packaging Plant
Example (hypothetical): A plant runs three packaging lines. The manager relies on end-of-shift sheets and walk-arounds, so a slow line is often noticed hours late.
Data collected: For each line, the PLC provides machine state, production count, current rate and active fault code.
Dashboard design:
- Top row: one status tile per line showing running, idle or faulted, and time in that state.
- Middle: shift count against target and current rate against standard rate.
- Side panel: active alarms that need action, sorted by priority.
- Bottom: an eight-hour trend of rate for each line.
Alerting: A line-stop alarm notifies the shift technician and escalates to the supervisor if unacknowledged.
Possible outcome: The manager can see from a phone which line is behind pace before the shift ends and ask the right question at the right time. This is an illustration. Any real project should measure its own baseline before and after.
What to Put on a Plant Manager's Dashboard
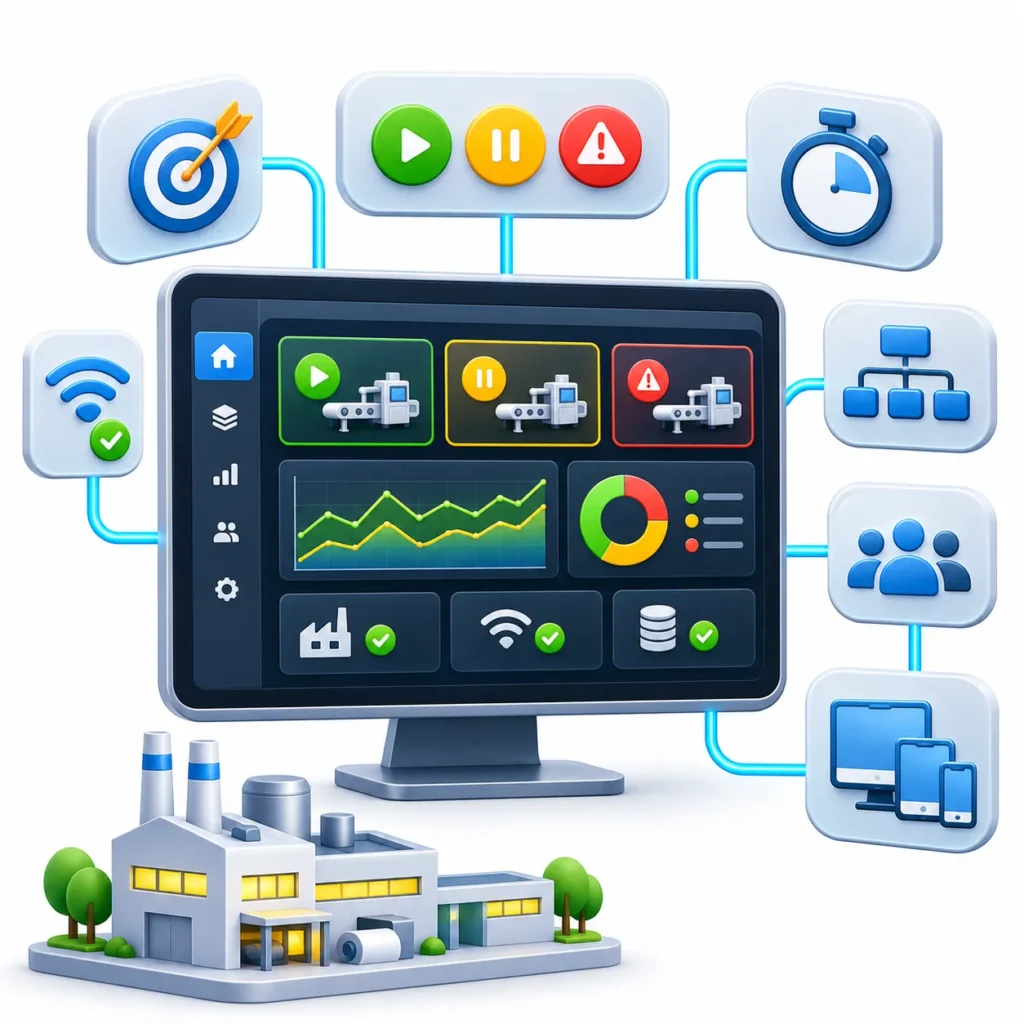
- Lead with decisions, not data. Status, pace against target and top problems come first.
- Define states consistently. Agree what running, idle and faulted mean across all machines.
- Show time in state. “Faulted for 12 minutes” is more useful than “Faulted.”
- Show data health. Display communication status so a stale value is not mistaken for a good one.
- Allow drill-down. Plant, then line, then machine.
- Use role-based views. Operators, supervisors and managers need different screens and permissions.
- Test on real devices. Check phones, tablets and wall displays in actual plant conditions.
Benefits and Limits
Area | What Ignition helps with | Limit to plan for |
Awareness | Live state, counts and alarms in one place | Only covers data that is connected and modeled |
Access | Browser and mobile dashboards | Needs network access, security design and device testing |
Context | History alongside live values | Needs historian setup and data retention planning |
Performance metrics | OEE with MES modules | OEE needs agreed definitions and standard rates |
Downtime reasons | Fault data captured automatically | Reasons often need operator input or MES workflows |
Common Challenges
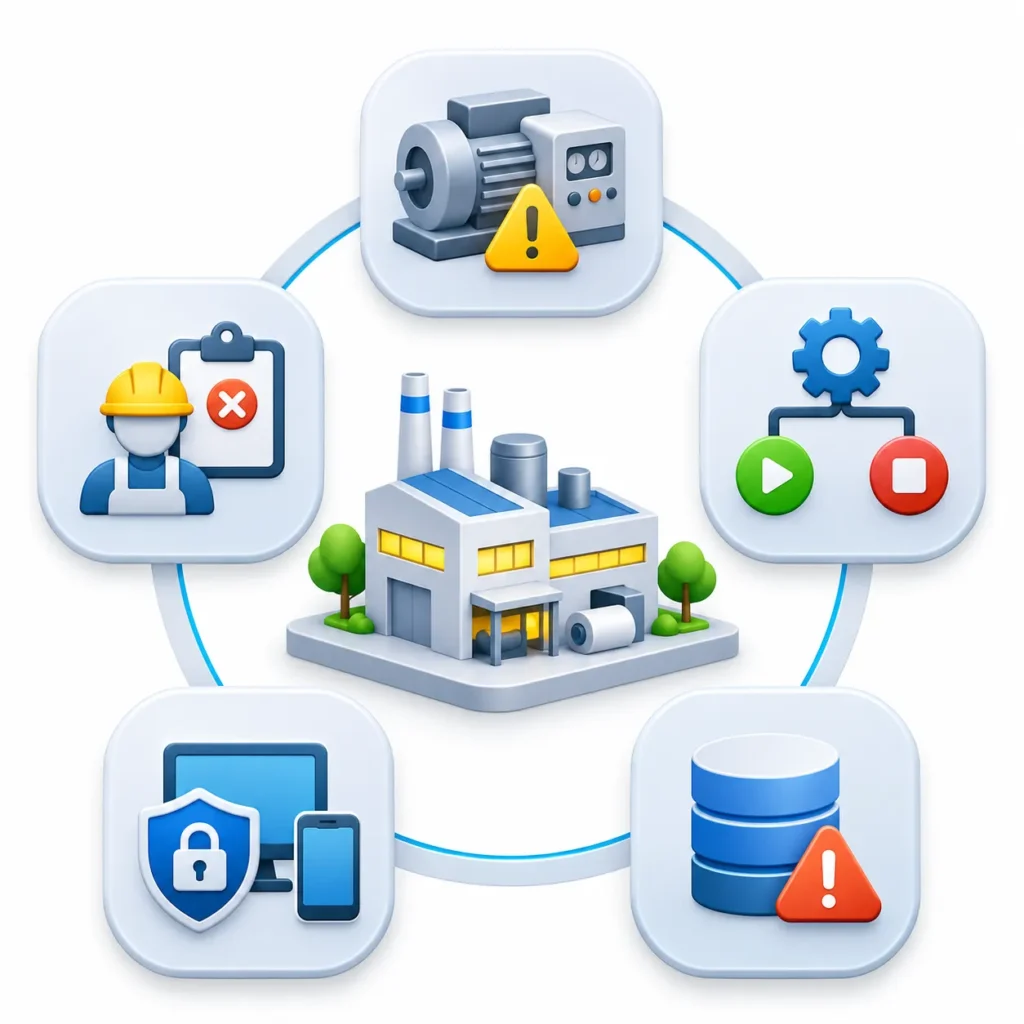
- Legacy equipment: Older machines may expose little data, which can require sensors, gateways or PLC changes.
- Inconsistent state logic: Different machines define running and stopped differently.
- Data quality: Miscounts, missing fault codes and unreliable sensors undermine trust.
- Cybersecurity: Remote and mobile access need careful network, authentication and permission design.
- Adoption: If operators do not trust the screens, they will go back to paper.
A Simple Starting Framework
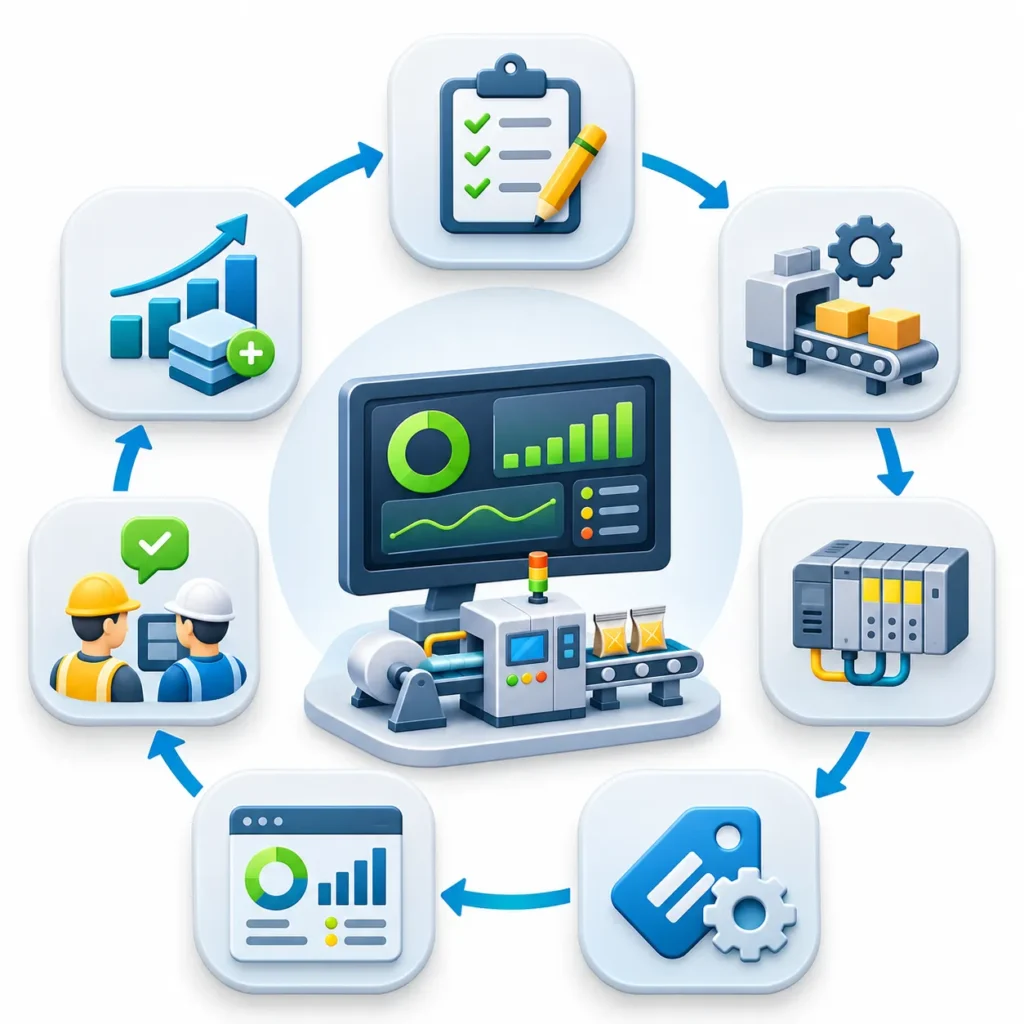
- Define the questions. List what the plant manager needs to know each shift.
- Pick one area. Start with one line or department.
- Check the data. Confirm which states, counts and faults the PLCs already expose.
- Standardize tags and states. Use common names and definitions.
- Build a simple dashboard. Status, pace, alarms and a short trend.
- Validate with operators. Compare screens with what they see on the floor.
- Extend deliberately. Add history, reports, OEE and more lines once the first one is trusted.
Conclusion
Ignition SCADA reduces unplanned downtime mainly by shortening detection and response, then giving maintenance the history to eliminate repeat causes. The benefit depends on the basics: reliable machine data, a disciplined alarm design, and clear ownership of each alert. Without those, faster notifications simply deliver noise faster.
Plants weighing this approach should start with one costly line, measure current stop behavior, and check what data their PLCs can already provide. For teams assessing Ignition for downtime reduction, INGSOL typically begins by mapping machines, available data, and response workflows before configuring alarms or notifications.
Contact our Ignition SCADA specialists directly:
Email: sales@ingsol.com
Phone (India): +91 95608 11774
Phone (US): +1 347 570 2629
Our engineers will review your current setup and outline a practical upgrade path built for your plant.