
Analytics Technology
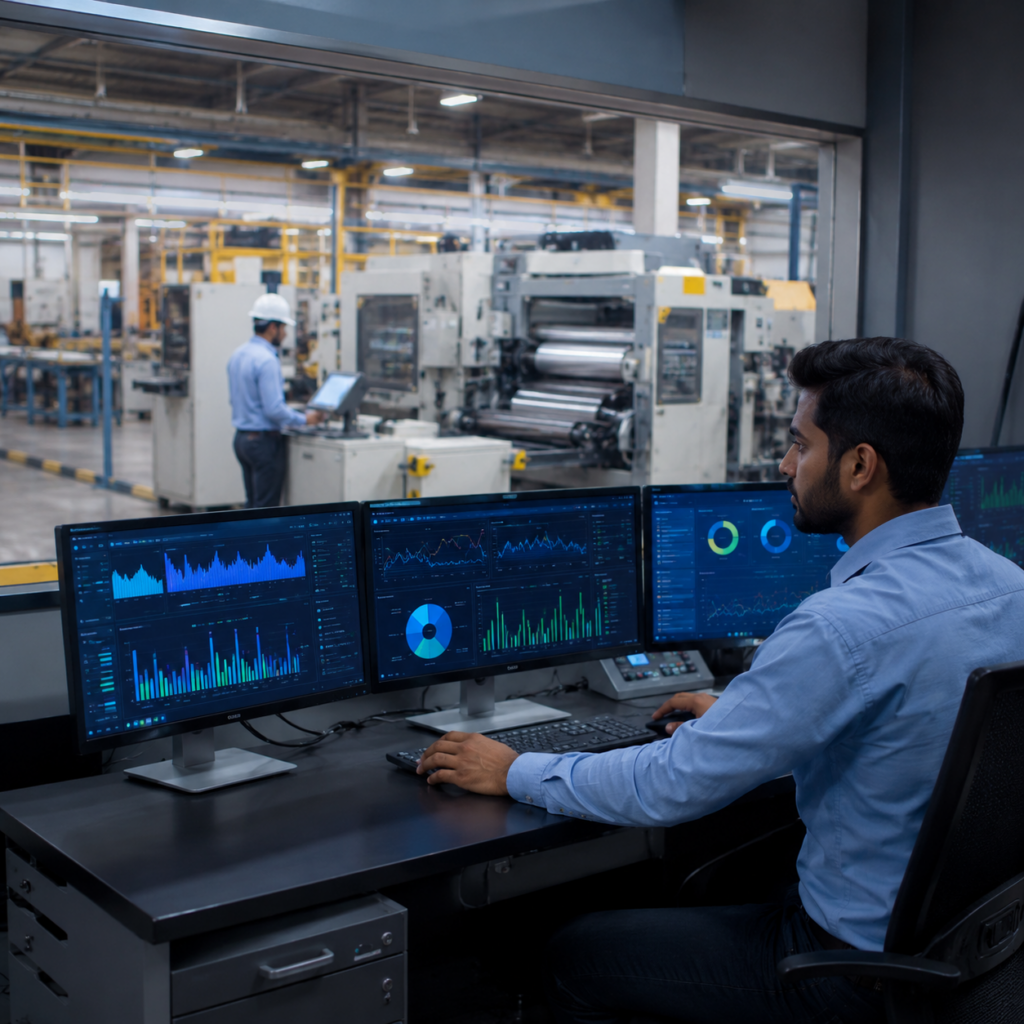
Analytics: Turning Shopfloor Data Into Decisions
Collecting data is not the same as using it. Many factories already have sensors, PLCs and historians producing more information than anyone reviews, while decisions about changeovers, energy use and maintenance are still made on instinct. INGSOL’s analytics capability closes that gap, turning raw shopfloor data into clear, actionable insight for operators, supervisors and management. This page explains the levels of industrial analytics, what INGSOL delivers at each one, and how it applies across factories and manufacturing plants of every kind.
What Industrial Analytics Means
Industrial analytics is the practice of turning data from machines, sensors and systems into information people can act on, spanning everything from a simple real-time dashboard to a model that predicts a failure weeks in advance. It sits on top of the data infrastructure and connectivity a plant already has, and it depends entirely on the reliability of that foundation: analytics built on inconsistent or incomplete data produces confident-looking answers to the wrong questions.
Analytics is not a replacement for engineering judgement, and a dashboard on its own does not improve performance. Its value comes from being embedded into how operators, supervisors and engineers make decisions every day.
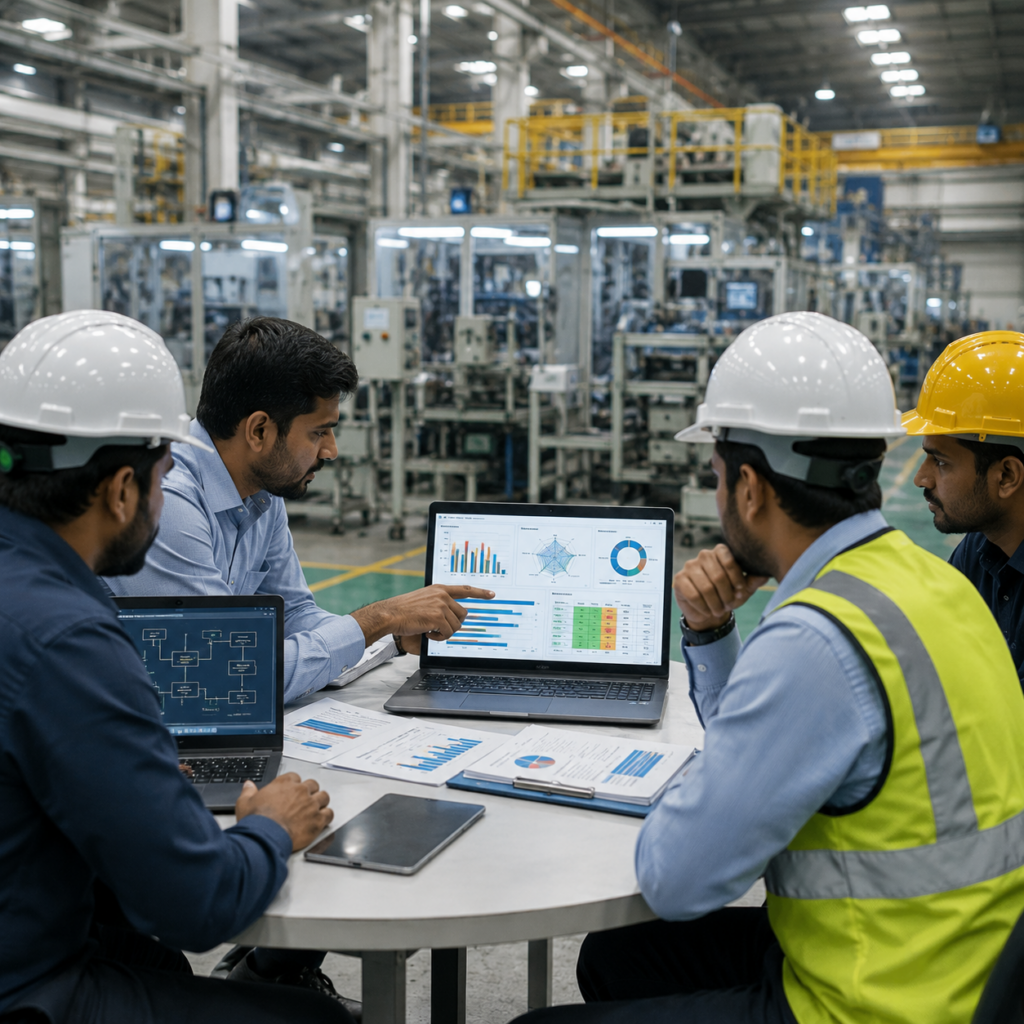
Four Levels of Industrial Analytics
INGSOL builds analytics capability through these levels in sequence, since predictive and prescriptive analytics are only as reliable as the descriptive and diagnostic foundation beneath them.
DESCRIPTIVE ANALYTICS:
What is happening right now: live equipment status, production counts, alarms and quality parameters, presented on unified dashboards.
DIAGNOSTIC ANALYTICS:
Why something happened: correlating scrap spikes, downtime events or energy peaks with specific conditions, shifts, grades or equipment.
PREDICTIVE ANALYTICS:
What is likely to happen next: models that anticipate equipment failures, quality drift or demand changes before they occur, based on historical and real-time patterns
PRESCRIPTIVE ANALYTICS:
What to do about it: recommendations or automated adjustments, such as optimised line speed or maintenance scheduling, based on current and predicted conditions.
Where INGSOL Applies Analytics

Overall Equipment Effectiveness (OEE)
INGSOL tracks OEE by equipment and production line in real time, breaking performance down into availability, performance and quality components. This replaces estimated or end-of-shift OEE figures with a measured, continuously updated view that shows exactly where losses are occurring and on which asset.

Changeover and Start-Up Analytics
Rather than relying on average estimates, INGSOL measures actual changeover duration and start-up scrap against defined targets, identifying why similar changeovers or product grades vary in setup time and waste. This turns changeover improvement from a one-off project into a measured, ongoing discipline.

Energy Analytics
INGSOL tracks energy consumption per unit of output at the asset level, rather than relying on a single plant-wide utility bill. This makes it possible to identify specific inefficient equipment, drives or heating elements, and to align line speeds with the most energy-efficient operating range for each process.

Quality Analytics
By correlating quality parameters, such as gauge, tensile strength or surface defects, with process conditions, INGSOL helps identify the root causes of quality escapes and rework, rather than treating each incident as isolated. Where appropriate, this extends to vision-based inspection systems that catch defects at line speed, beyond what manual inspection can reliably detect.

Predictive Maintenance
Using vibration, temperature and energy trends captured over time, INGSOL applies machine learning models to anticipate equipment failures, often weeks before they would otherwise occur. This shifts maintenance from a fixed calendar schedule to one driven by actual asset condition, reducing both unplanned downtime and unnecessary servicing.

The Infrastructure Behind Reliable Analytics
INGSOL builds analytics on a data infrastructure designed for industrial time-series data at scale. PostgreSQL provides reliable storage for production and configuration data, TimescaleDB handles high-volume sensor and process data as a time-series extension of PostgreSQL, and TimeBase supports particularly demanding, high-frequency workloads. Grafana and Ignition provide the dashboards and visualisation layer on top, giving operators, supervisors and management a live, configurable view of the metrics that matter to their role.
Why the Same Methodology Works Across Industries
We begin by confirming that the underlying OT infrastructure and connectivity are reliable, since analytics built on inconsistent data undermines trust in the results
Dashboards and models are built around the specific losses, quality parameters and equipment that matter most to your operation, not a generic analytics template.
Analytics capability is introduced in phases, starting with real-time visibility and diagnostic analysis before moving to predictive and prescriptive models once sufficient data history exists.
Dashboards run on plant premises for continuous, low-latency access, with enterprise-level and cross-site analytics aggregated in the cloud where that adds value.
Why Manufacturers Choose INGSOL for Analytics

OPEN, PROVEN TECHNOLOGY:
Built on postgresql, timescaledb, timebase, Grafana and Ignition, avoiding dependence on a single proprietary analytics vendor.

ENGINEERING CONTEXT:
Engineers who understand extrusion, machining, assembly or process physics, so analytics reflect how your equipment actually behaves, not a generic statistical model.

FULL-STACK DELIVERY:
DASHBOARDS, Quick-win visibility and full predictive models are delivered as part of one coherent roadmap, not disconnected projects.

PART OF A COMPLETE ARCHITECTURE:
Analytics work sits alongside INGSOL’s Hardware & Edge, Communication & Integration and Digital Transformation capability, so it is supported by reliable data from day one.

Where to Start: The Digital Transformation Maturity Assessment
INGSOL’s Digital Transformation Maturity Assessment (DTMA) evaluates your current OT infrastructure, data quality and existing systems, identifying which analytics capability, real-time visibility, diagnostic reporting, or predictive modelling, will deliver the fastest, most reliable return for your plant.
INGSOL helps factories and manufacturing plants move from raw shopfloor data to real-time visibility, diagnostic insight and predictive analytics that operators and management can act on. Get in touch to discuss your analytics requirements or a Digital Transformation Maturity Assessment for your plant.
Our Clients


















membership